What does “Fit Quality” or “Result Confidence” mean within FoCal calibration results?
Fit Quality or Result Confidence is a measure of how well the individual validated test points on the lens profile graph match up with the expected behaviour of a normal lens. Values of “Poor”, “Acceptable”, “Good” or “Excellent” are used within FoCal.
During an Automatic Focus Calibration FoCal takes a series of test images at different AF Microadjustment (auto focus fine tune) values to determine which setting will provide optimum results for that particular camera/lens combination. Points are validated (an orange dot is placed inside the red diamond) when a number of the test shots at that same AF Mircoadjustment value are within a certain percent.
Quality of Focus (QoF) is plotted against AF Microadjustment on the lens profile graph on the bottom right of the calibration window. This graph is at the heart of how FoCal works, it determines the best auto focus calibration value and shows how focus quality changes as the AF Microadjustment value changes. The orange line represents how the sharpness is expected to change through all the values, with the highest point on the line corresponding to the calculated optimum AF Microadjustment result.
FoCal is not looking simply for the single sharpest image or a
lucky shot because that’s not how cameras/lenses behave, FoCal needs to look past a single image and see the trend to work out what AF Microadjustment value is going to give the highest percentage of well focused images.
Example Lens Profile Graph: Fit Quality Poor
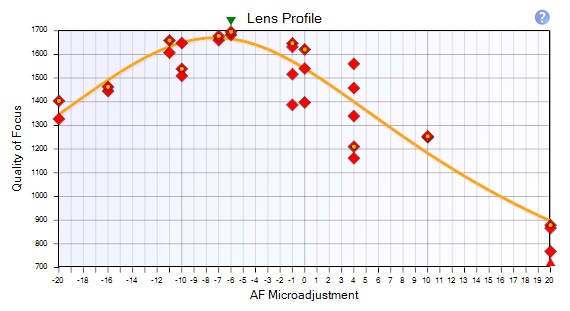 The orange line is a fair way from some of validated test points (the red diamond with the orange dots in). This result was caused by incorrect target distance and low lighting.
Note also how much the Quality of Focus value changes for the test shots at AF Microadjustment +4 likely a sign of insufficient light / slow shutter speed leading to shot vibration. This spread of red diamonds are indicating focus consistency, the closer they are together the better the focus consistency.
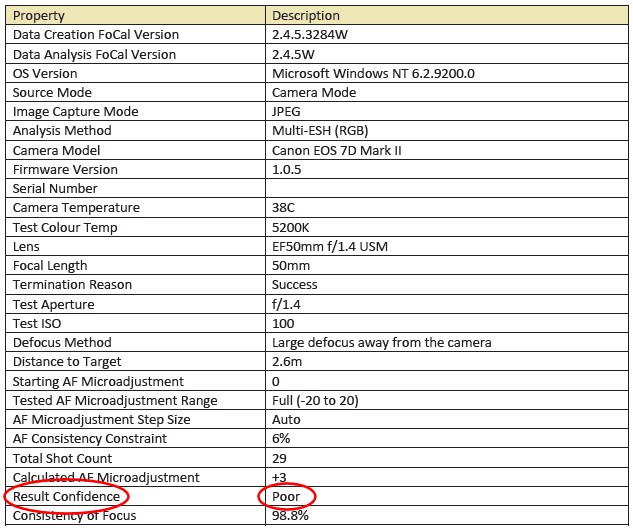
If you are using FoCal Pro you can also view results via the saved PDF report, in this case the Fit Quality is recorded within the report using the term “Result Confidence” (the different terms are interchangeable and mean the same thing). An example from the top section of the automatic focus calibration PDF report shown below.
Example Lens Profile Graph: Fit Quality Excellent
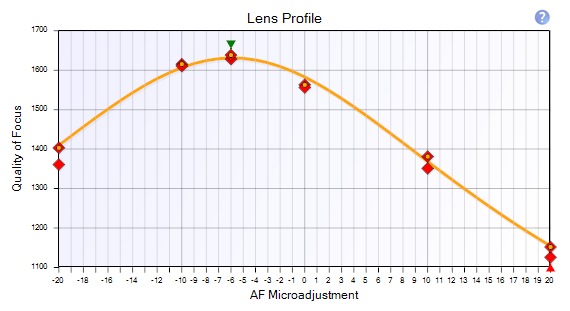 Excellent fit quality with the orange line closely matching up with the validated plotted points.
Note also how close together or well grouped the red diamonds are at each of the AF Microadjusment test values. The closeness of red diamonds indicate good focus consistency.
Acceptable or Poor Fit Quality?
If you’re consistently seeing a Fit Quality of “Poor” or “Acceptable” it’s worth investigating what could be causing that. Target distance (see What distance should I use for auto focus calibration?) can be a factor as well as camera or shot vibration, adding light to a target can help ensure more consistent results. Another thing worth checking; is the eyepiece is covered. Light entering the eyepiece can sometimes cause issues, covering the eye piece with black tape or blocking the light in some way can help.
The lens profile graph provides other useful information, for example you can get an idea of focus consistency by looking at the groupings of test images at the same AF adjustment value. As you calibrate different lenses and become more familiar using FoCal you’ll get a feel for how the graph is used within Focal to calculate focus adjustments.